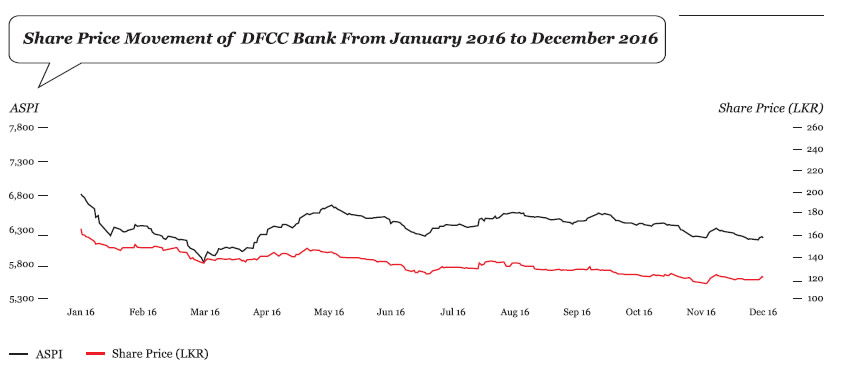
The market value of the DFCC Bank PLC ordinary share on 31 December 2016 was LKR 122.50 compared to LKR 168.90 on 31 December 2015. During the 12 months period, the highest price recorded was LKR 170.00 while the lowest price recorded during the period was LKR 116.10.
The share price of DFCC Bank followed the movement of the All Share Price Index (ASPI) closely during the period under review.
| Period 1 January to 31 December 2016 | Period 1 April to 31 December 2015 | Period 1 April to 31 March | ||
| 2015 | 2014 | |||
| Price Indices | ||||
| ASPI | 6,228.26 | 6,894.50 | 6,820.34 | 5,968.31 |
| S&P SL20 | 3,496.44 | 3,625.69 | 3,852.43 | 3,279.92 |
| Share Price | ||||
| Lowest Price (LKR) | 116.8 | 155.0 | 144.7 | 115.0 |
| Highest Price (LKR) | 168.1 | 230.0 | 239.0 | 154.0 |
| Closing Price (LKR) | 122.5 | 168.90 | 202.9 | 143.0 |
| Market Capitalisation | ||||
| Value (LKR million) | 32,474 | 44,775 | 53,788 | 38,148 |
| Percentage of total market cap | 1.18% | 1.52 | 1.86 | 1.53 |
| Rank | 18 | 14 | 11 | 13 |
| Value of Shares Traded | ||||
| Value (LKR million) | 1,308.91 | 1,717 | 6,761 | 906 |
| Percentage of total market turnover | 0.73% | 0.91 | 1.91 | 0.46 |
| Rank | 29 | 25 | 9 | 45 |
| Days Traded | ||||
| Number of days traded | 240 | 182 | 239 | 241 |
| Total number of market days | 240 | 183 | 239 | 243 |
| Percentage of market days traded | 100.0% | 99.5 | 100.0 | 99.2 |
| Frequency of Shares Traded | ||||
| Number of transactions | 5350 | 4654 | 9020 | 5444 |
| Percentage of total frequency | 0.51% | 0.41 | 0.45 | 0.37 |
| Rank | 60 | 81 | 78 | 82 |